Historical Context: 2026 Is Outperforming the Average Midterm Year
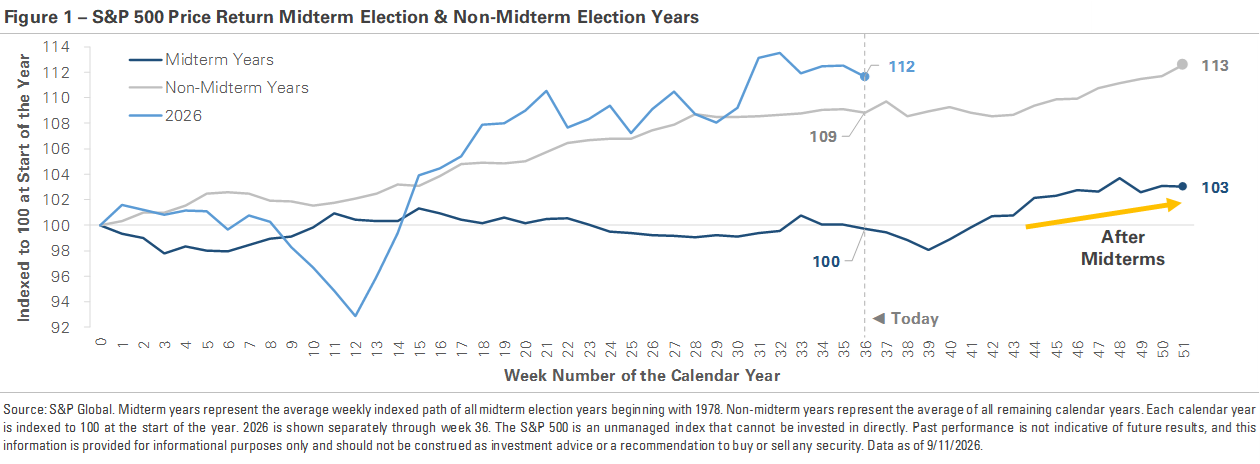
Midterm election years have historically been more volatile than other years, and they've historically delivered weaker returns. This year has followed a very different path. The S&P 500 has gained nearly +12% year-to-date. For comparison, the average midterm year is historically flat at the same point, while the average non-midterm year is up nearly +9%. This year has outperformed not only the typical midterm year but also the average non-midterm year. The chart below compares the S&P 500's year-to-date price return against the average return path of midterm and non-midterm years since 1978, with each year indexed to 100 at the start of the year.
Midterm election years have historically been more volatile than other years, and they've historically delivered weaker returns. This year has followed a very different path. The S&P 500 has gained nearly +12% year-to-date. For comparison, the average midterm year is historically flat at the same point, while the average non-midterm year is up nearly +9%. This year has outperformed not only the typical midterm year but also the average non-midterm year. The chart below compares the S&P 500's year-to-date price return against the average return path of midterm and non-midterm years since 1978, with each year indexed to 100 at the start of the year.
The explanation for the historical midterm pattern is that these years carry an unusual amount of policy uncertainty around future taxes, spending plans, and regulatory changes. Investors generally dislike unresolved questions. Markets have been volatile this year, but the source has been geopolitical and macroeconomic rather than electoral. The S&P 500 fell -5% in Q1 before rebounding more than +20%. Geopolitical tensions have contributed to sharp moves in oil prices, long-term Treasury yields have climbed to multi-decade highs, and uncertainty around the Federal Reserve's policy has repeatedly shifted the outlook for interest rates. The volatility midterm years are known for has appeared, but the election calendar hasn't been the cause, and the weak returns haven't followed either.
The chart also shows markets have historically traded higher once the election passes and attention returns to earnings and economic growth. Those fundamentals have driven the market this year. Strong corporate earnings have helped support the stock market's valuation. Artificial intelligence investment has fueled spending on data centers, computer chips, software, and power infrastructure, supporting both company profits and broader economic growth. The economy has also continued to expand, supported by steady consumer spending and business investment. None of these drivers depend on an election outcome. Corporate earnings, interest rates, and consumer demand operate on their own timelines.
This year's divergence from the historical midterm pattern is a useful reminder of the limits of market averages. An investor could have entered 2026 knowing that midterm years have historically produced more volatility and weaker returns. Expecting a difficult market would have been reasonable. The mistake would have been treating that historical average as a return forecast. Historical patterns are useful because they show what markets have tended to do under similar circumstances. They are less useful when the average becomes a prediction for a single year. The takeaway: Use history as context for what might happen along the way, but don't use it as a forecast of where you'll end up.
As always, our team remains available to discuss any questions you may have or to review your financial strategy in light of the latest market developments.
Kind regards,
Team PYGG
PYGG Securities Co B.V.